LabAssay™ NEFA (FFA)
| Grade : | for Cellbiology |
| Storage Condition : | Keep at 2-10 degrees C. |

| Catalogue/Product Number | Package Size | COA Download |
|---|---|---|
|
299-94301
|
500Tests |

Document
Overview
This product has been featured in more than 110 publications since 2021 alone (based on a Google Scholar search as of December 2025). Examples of the species and sample types used are available under "Publications" below.
*This information is not intended to guarantee suitability for any specific application.
Kit component
For 500 tests
| Chromogen Reagent A | for 10 mL / 4 bottles |
|---|---|
| Solvent A (for Chromogen Reagent A) | 45 mL / 1 bottle |
| Chromogen Reagent B | for 20 mL / 4 bottles |
| Solvent B (for Chromogen Reagent B) | 90 mL / 1 bottle |
| Standard Solution | 7 mL / 1 bottle |
NEFA (Non‐esterified fatty acid) in the blood is transported complexed with an albumin to peripheral tissues. They are important sources of fuel for the peripheral tissues. The concentration of NEFA in the blood is regulated by a release from the adipose tissues, a consumption in the periphral tissues or a take up from the liver.
LabAssay™ NEFA (FFA) is a kit designed to measure non-esterified fatty acids (NEFA) in samples using the ACS-ACOD method.
[Note] LabAssay™ series are reagents for research purposes. They cannot be used for diagnostic purposes.
Kit Performance
| Analysis sample | Mouse Serum/Plasma Rat Serum/Plasma Dog Serum/Plasma Cat Serum/Plasma Culture medium (D-MEM)* |
|---|---|
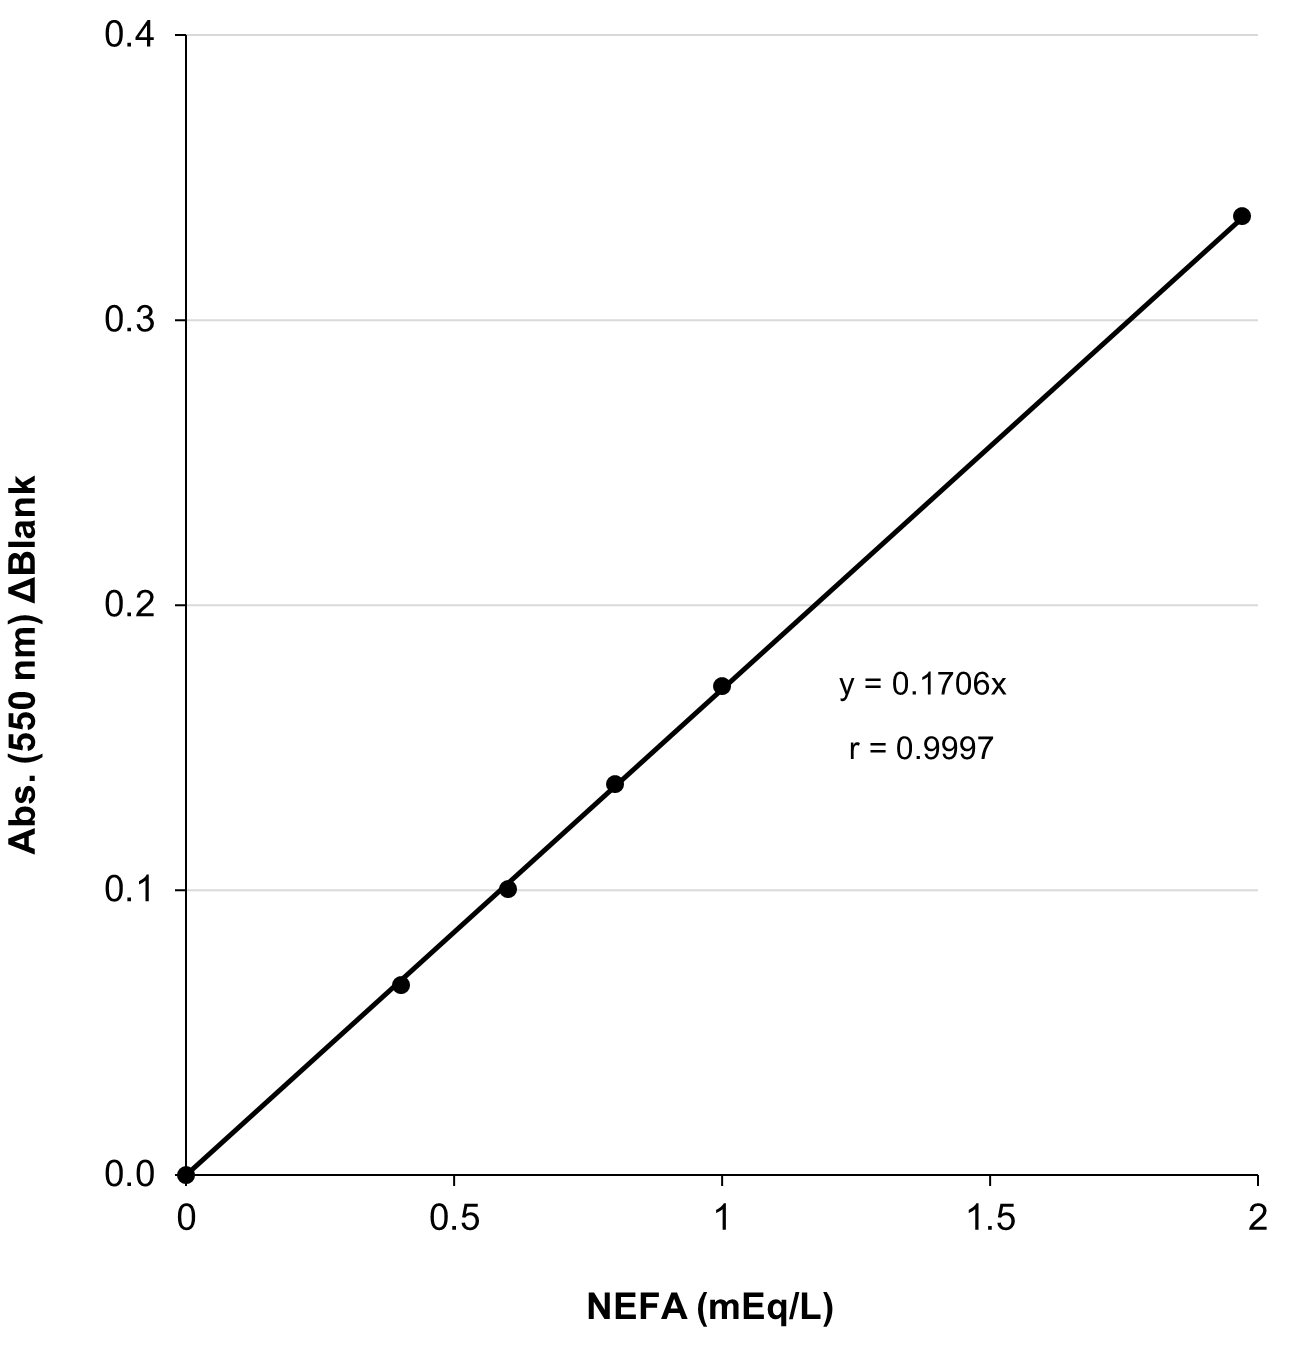
| Calibration curve range | 0.4-1.97 mEq/L *Oleic acid 1 mEq=1 mmol |
| Sample volume | 4 μL |
| Measurement duration | Approx. 20 min |
| Wavelength | 550 nm |
*It is tested by using the samples that standard substances have been added to the culture medium.
Measurement availability depends on the culture medium, cell type and culture conditions. Please perform a spiked recovery test or dilution linearity test in advance using the culture medium to be used in your experiment.
Example of Calibration Curve
Assay Principle
NEFA (Non‐esterified fatty acid) forms Acyl-CoA in the presence of Acyl-CoA synthetase (ACS). Hydrogen peroxide, which is produced by a reaction between the Acyl-CoA and Acyl-CoA oxidase (ACOD), promotes oxidative condensation of 3-methyl-N-ethyl-N-(β-hydroxyethyl)-aniline (MEHA) with 4-aminoantipyrine. LabAssay™ NEFA can be used for the quantitative determination of NEFA in samples by measuring absorbance of a blue purple color which is generated by the oxidative condensation reaction.

Procedure
Assay in a microplate
Perform the assay in the wells according to the following table scheme.
| Test | Standard | Reagent Blank | Sample Blank *1 | |
|---|---|---|---|---|
| Color Reagent A | 80 μL | 80 μL | 80 μL | 80 μL |
| Specimen | Serum 4 μL | Standard 4 μL | Distilled or Deionized water 4 μL | - |
| Mix well *2 and incubate at 37°C for 10 min. | ||||
| Color Reagent B | 160 μL | 160 μL | 160 μL | 160 μL |
| Specimen | - | - | - | Serum 4 μL |
| Mix well *2 and incubate at 37℃ for 10 min. | ||||
| After cooling the reaction solution to room temperature, measure the absorbance at 550 nm of the test sample and standard solution with the blank solution as the control within the next 30 min. | ||||
*1 Sample blank is not required for common samples, but required for chyle or hemolyzed sample.
*2 Mix well with a plate mixer at 600 - 1,000 rpm for 1 minute. Be careful not to spill from the well
Data
Repeatability (within run precision)
Repeatability was conducted by measuring sixfold assays of serum/plasma (EDTA) samples from mouse and rat at two concentrations with this product.
| n\ID | Mouse serum | Rat serum | ||
|---|---|---|---|---|
| ID1 (mEq/L) | ID2 (mEq/L) | ID1 (mEq/L) | ID2 (mEq/L) | |
| 1 | 1.439 | 0.523 | 0.936 | 0.542 |
| 2 | 1.483 | 0.505 | 0.933 | 0.565 |
| 3 | 1.499 | 0.522 | 0.941 | 0.566 |
| 4 | 1.449 | 0.543 | 0.948 | 0.561 |
| 5 | 1.439 | 0.541 | 0.931 | 0.547 |
| 6 | 1.470 | 0.518 | 0.928 | 0.526 |
| mean | 1.463 | 0.525 | 0.936 | 0.551 |
| SD | 0.02487 | 0.0144 | 0.00731 | 0.0158 |
| CV(%) | 1.7 | 2.7 | 0.8 | 2.9 |
[Result]
The CV (%) of mouse serum was 1.7-2.7% and rat serum was 0.8-2.9%, indicating good repeatability.
Reproducibility (between run precision)
Reproducibility was conducted by measuring serum samples from mouse and rat at three concentrations each for four days with this product.
| Day\ID | Mouse serum | Rat serum | ||||
|---|---|---|---|---|---|---|
| ID3 (mEq/L) | ID4 (mEq/L) | ID5 (mEq/L) | ID3 (mEq/L) | ID4 (mEq/L) | ID5 (mEq/L) | |
| 1 | 1.018 | 0.802 | 0.596 | 0.726 | 0.562 | 0.434 |
| 2 | 1.019 | 0.784 | 0.582 | 0.836 | 0.632 | 0.477 |
| 3 | 1.021 | 0.787 | 0.580 | 0.800 | 0.612 | 0.465 |
| 4 | 1.020 | 0.791 | 0.585 | 0.824 | 0.620 | 0.479 |
| mean | 1.020 | 0.791 | 0.586 | 0.797 | 0.607 | 0.464 |
| SD | 0.001291 | 0.00787 | 0.00714 | 0.0493 | 0.0308 | 0.0208 |
| CV(%) | 0.1 | 1.0 | 1.2 | 6.2 | 5.1 | 4.5 |
[Result]
The CV (%) of mouse serum was 0.1-1.2% and rat serum was 4.5-6.2%, indicating good reproducibility.
Dilution Linearity Test
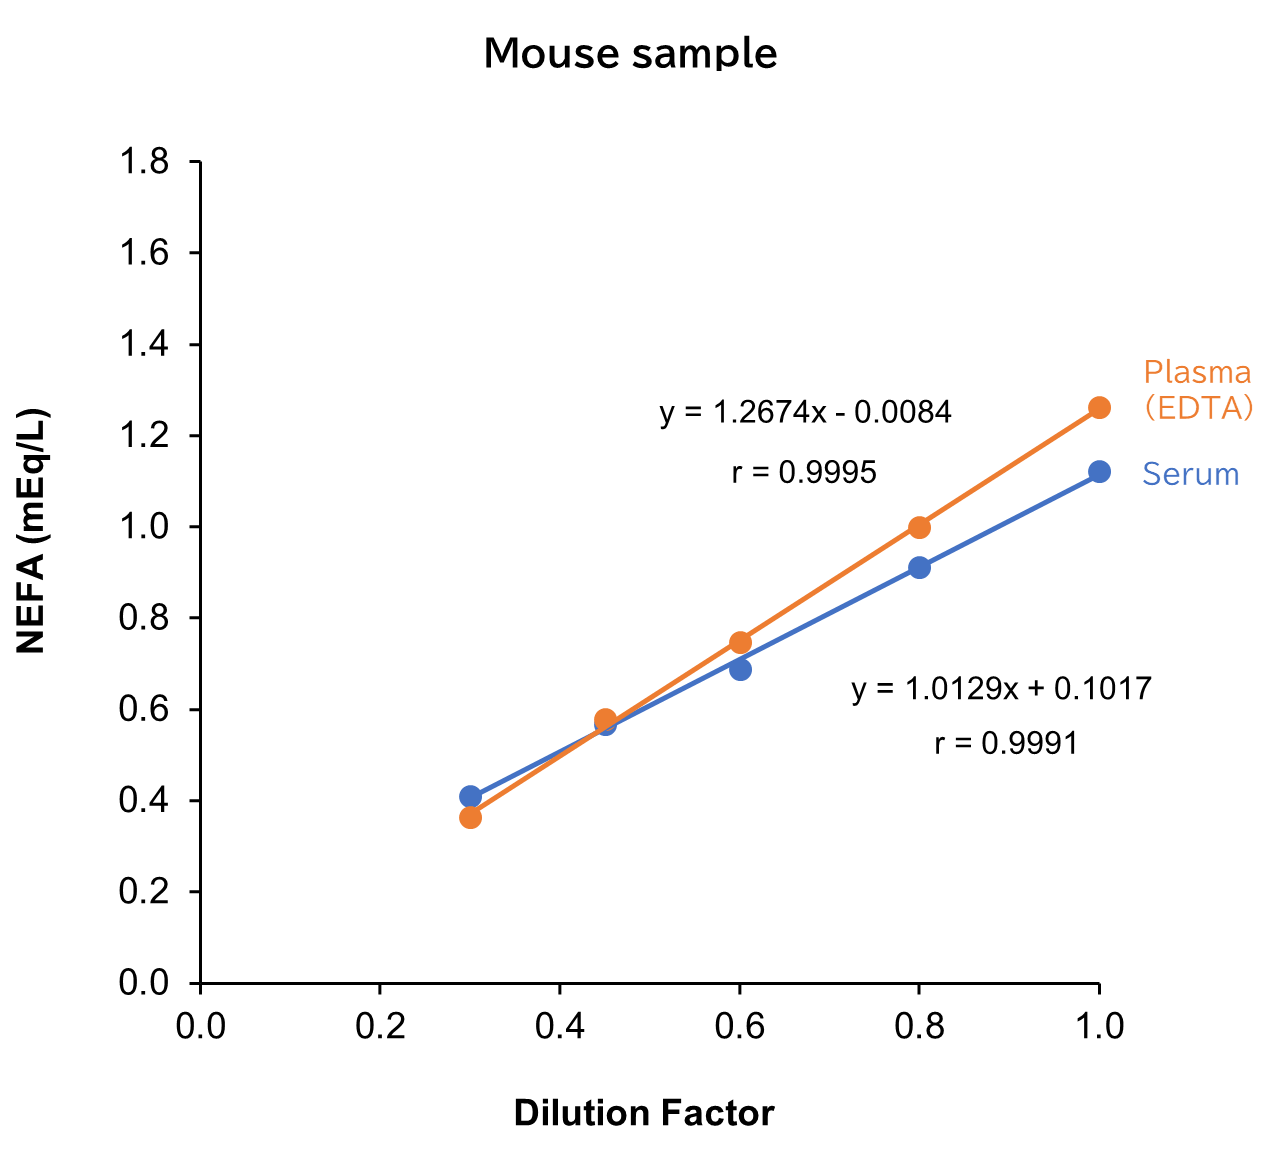
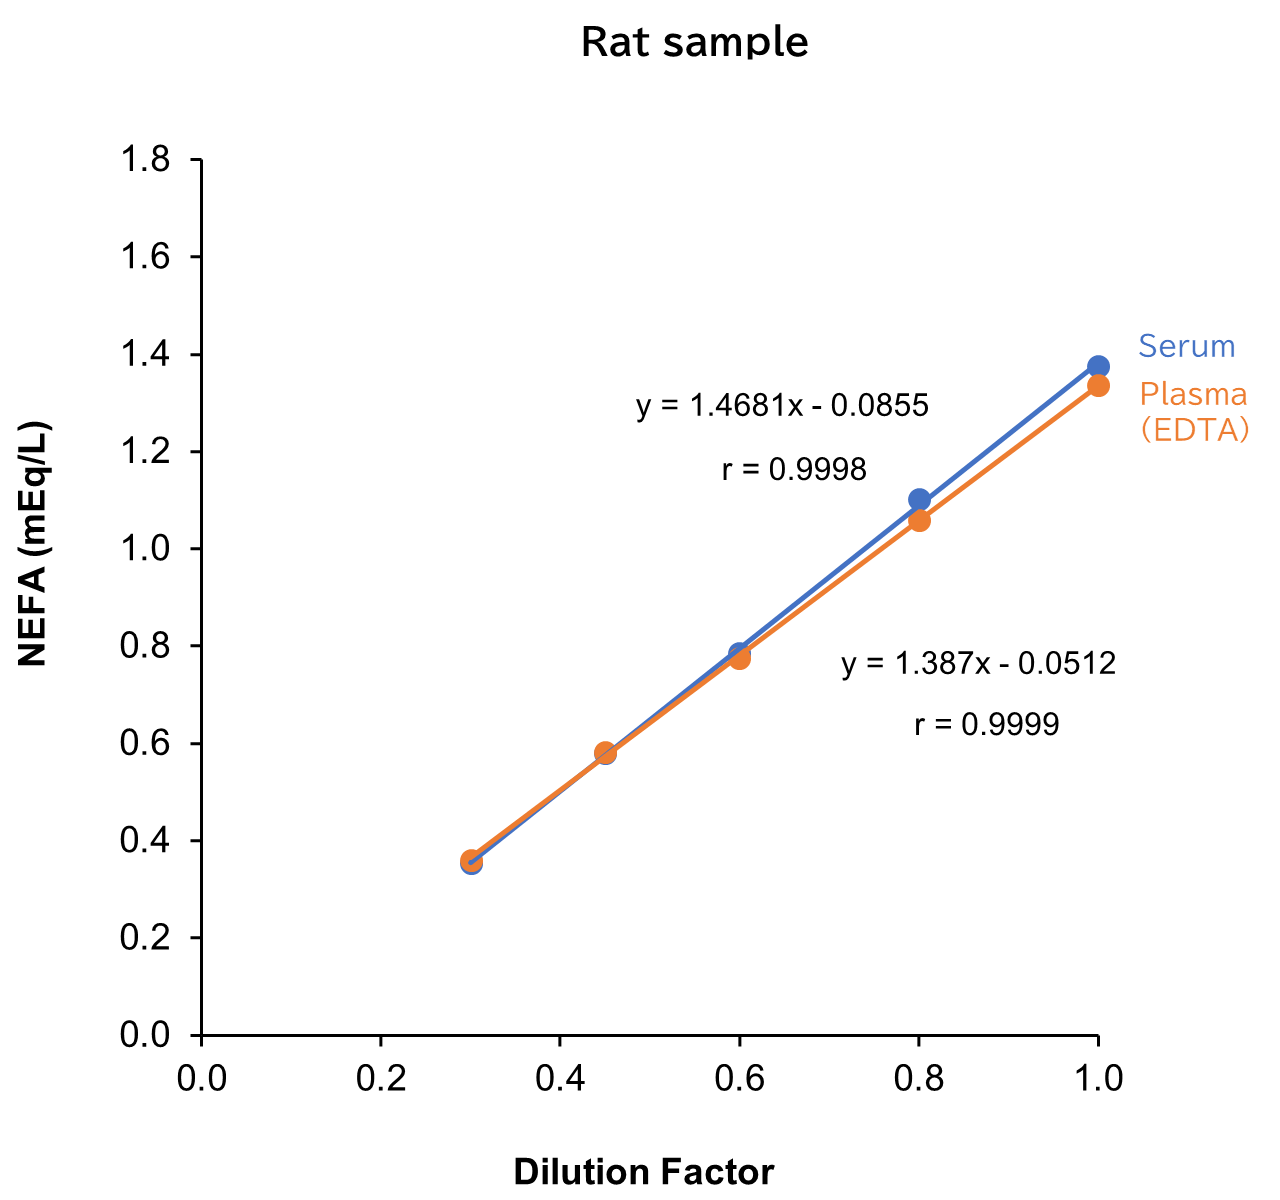
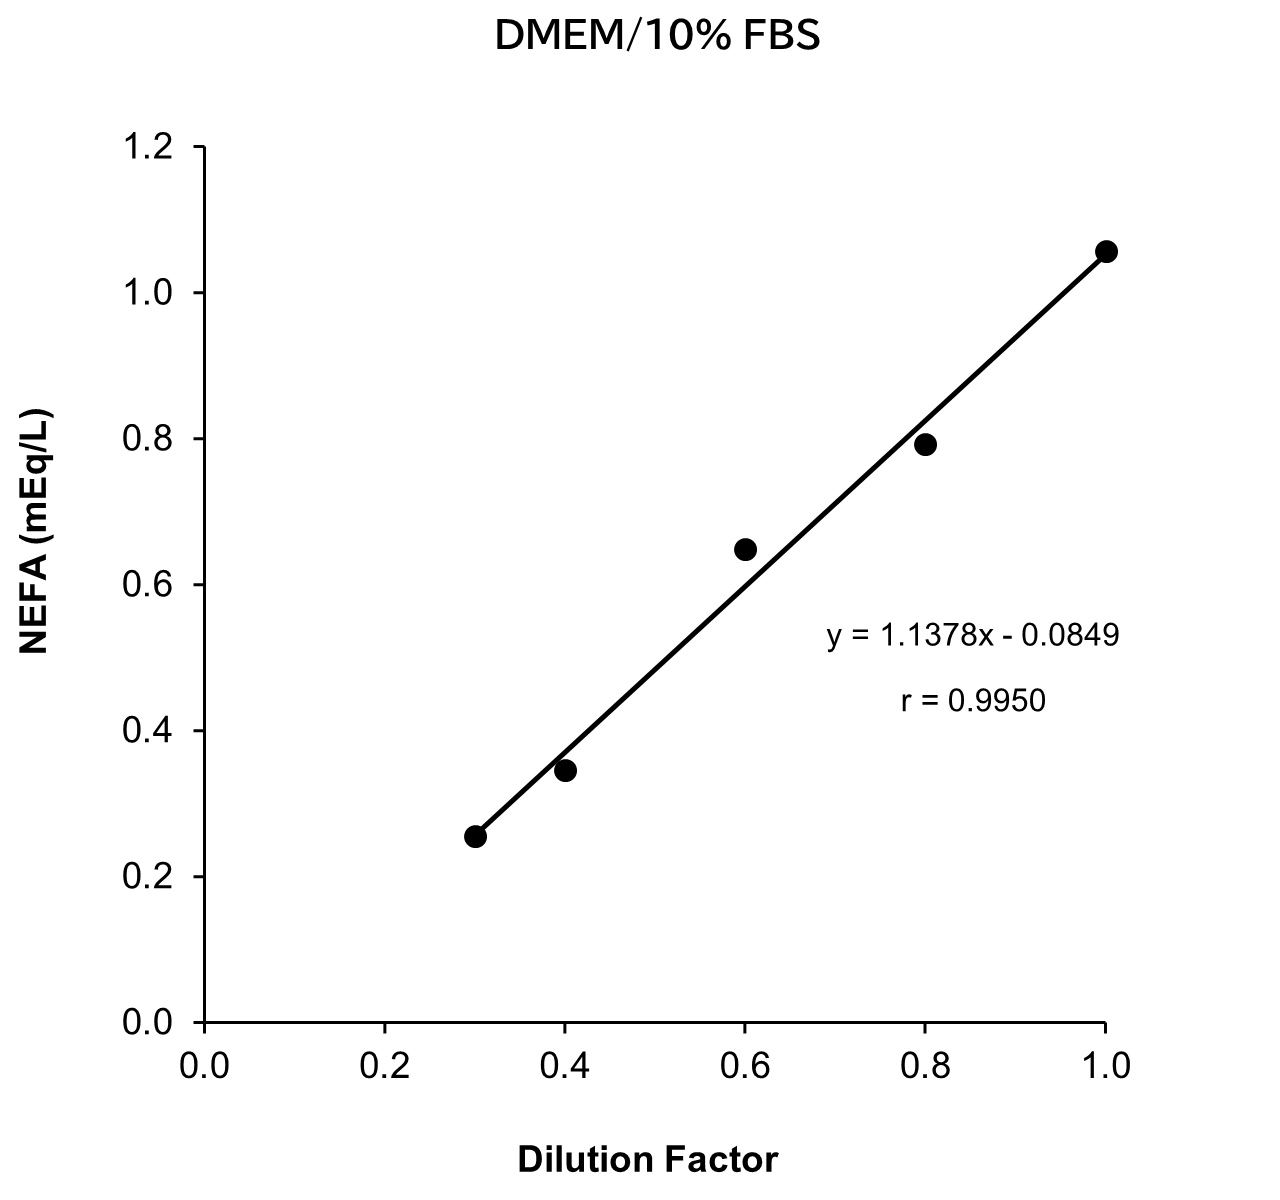
Serum and plasma (EDTA) from mouse and rat, as well as D-MEM containing 10% FBS spiked with the standard, were serially diluted twofold with saline and measured in duplicate to assess linearity.
[Result]
All measurement results showed good linearity within the measurement range.
Spike and Recovery Test
Standard solutions at four concentrations were added to serum/plasma (EDTA) from mouse and rat. Next, spike recovery tests were conducted, with each measurement performed in duplicate.
Mouse sample
| Spiked amount (mEq/L) | Measurement value (mEq/L) | Recovery volume (mEq/L) | Recovery rate (%) | |
|---|---|---|---|---|
| Serum | - | 0.70 | - | - |
| 0.40 | 1.07 | 0.37 | 92.5 | |
| 0.61 | 1.31 | 0.61 | 100 | |
| 0.78 | 1.44 | 0.74 | 94.9 | |
| 1.01 | 1.62 | 0.92 | 91.1 | |
| Average | 94.6 | |||
| Plasma (EDTA) | - | 0.62 | - | - |
| 0.40 | 0.99 | 0.37 | 92.5 | |
| 0.61 | 1.29 | 0.68 | 111 | |
| 0.78 | 1.38 | 0.77 | 98.7 | |
| 1.01 | 1.62 | 1.00 | 99.0 | |
| Average | 101 | |||
Rat sample
| Spiked amount (mEq/L) | Measurement value (mEq/L) | Recovery volume (mEq/L) | Recovery rate (%) | |
|---|---|---|---|---|
| Serum | - | 0.57 | - | - |
| 0.40 | 1.00 | 0.43 | 108 | |
| 0.61 | 1.21 | 0.65 | 107 | |
| 0.78 | 1.40 | 0.83 | 106 | |
| 1.01 | 1.57 | 1.01 | 100 | |
| Average | 105 | |||
| Plasma (EDTA) | - | 0.41 | - | - |
| 0.40 | 0.86 | 0.45 | 113 | |
| 0.61 | 1.07 | 0.66 | 108 | |
| 0.78 | 1.27 | 0.86 | 110 | |
| 1.01 | 1.44 | 1.02 | 101 | |
| Average | 110 | |||
[Result]
Good recovery rates were confirmed.
Measurement Using Actual Samples
Mouse sample (CD-1(ICR))
| ID\n | Measurement value (mEq/L) | mean | SD | CV (%) | ||
|---|---|---|---|---|---|---|
| 1 | 2 | |||||
| Seum | ID1 | 1.119 | 1.117 | 1.118 | 0.001414 | 0.1 |
| ID2 | 0.783 | 0.793 | 0.788 | 0.00707 | 0.9 | |
| ID3 | 0.700 | 0.731 | 0.716 | 0.0219 | 3.1 | |
| ID4 | 0.795 | 0.792 | 0.794 | 0.00212 | 0.3 | |
| ID5 | 0.825 | 0.833 | 0.829 | 0.00566 | 0.7 | |
| Plasma (EDTA) | ID1 | 0.311 | 0.308 | 0.310 | 0.00212 | 0.7 |
| ID2 | 0.319 | 0.321 | 0.320 | 0.00141 | 0.4 | |
| ID3 | 0.202 | 0.208 | 0.205 | 0.00424 | 2.1 | |
| ID4 | 0.173 | 0.185 | 0.179 | 0.00849 | 4.7 | |
| ID5 | 0.293 | 0.318 | 0.306 | 0.0177 | 5.8 | |
Rat sample (S.D. rat)
| ID\n | Measurement value (mEq/L) | mean | SD | CV (%) | ||
|---|---|---|---|---|---|---|
| 1 | 2 | |||||
| Seum | ID1 | 0.300 | 0.300 | 0.300 | 0.00 | 0.0 |
| ID2 | 0.373 | 0.368 | 0.371 | 0.00354 | 1.0 | |
| ID3 | 0.301 | 0.277 | 0.289 | 0.0170 | 5.9 | |
| ID4 | 0.365 | 0.364 | 0.365 | 0.000707 | 0.2 | |
| ID5 | 0.403 | 0.362 | 0.383 | 0.0290 | 7.6 | |
| Plasma (EDTA) | ID1 | 0.336 | 0.330 | 0.333 | 0.00377 | 1.1 |
| ID2 | 0.358 | 0.354 | 0.356 | 0.00283 | 0.8 | |
| ID3 | 0.311 | 0.339 | 0.325 | 0.0196 | 6.0 | |
| ID4 | 0.222 | 0.214 | 0.218 | 0.00566 | 2.6 | |
| ID5 | 0.522 | 0.508 | 0.515 | 0.00990 | 1.9 | |
Dog sample (Beagle)
| ID\n | Measurement value (mEq/L) | mean | SD | CV (%) | ||
|---|---|---|---|---|---|---|
| 1 | 2 | |||||
| Serum | ID1 | 0.654 | 0.657 | 0.656 | 0.00212 | 0.3 |
| ID2 | 0.642 | 0.688 | 0.665 | 0.0325 | 4.9 | |
| ID3 | 0.419 | 0.431 | 0.425 | 0.00849 | 2.0 | |
| ID4 | 0.377 | 0.383 | 0.380 | 0.00424 | 1.1 | |
| ID5 | 0.887 | 0.877 | 0.882 | 0.00707 | 0.8 | |
| ID6 | 0.604 | 0.595 | 0.600 | 0.00636 | 1.1 | |
| ID7 | 0.987 | 1.025 | 1.006 | 0.02687 | 2.7 | |
| ID8 | 0.501 | 0.510 | 0.506 | 0.00636 | 1.3 | |
| Plasma (EDTA) | ID1 | 0.440 | 0.444 | 0.442 | 0.00283 | 0.6 |
| ID2 | 0.419 | 0.435 | 0.427 | 0.0113 | 2.6 | |
| ID3 | 0.311 | 0.306 | 0.309 | 0.00354 | 1.1 | |
| ID4 | 0.470 | 0.487 | 0.479 | 0.0120 | 2.5 | |
| ID5 | 0.472 | 0.475 | 0.474 | 0.00212 | 0.4 | |
| ID6 | 0.370 | 0.364 | 0.367 | 0.00424 | 1.2 | |
| ID7 | 0.789 | 0.770 | 0.780 | 0.0134 | 1.7 | |
| ID8 | 0.439 | 0.384 | 0.412 | 0.0389 | 9.5 | |
Cat sample (Short hair)
| ID\n | Measurement value (mEq/L) | mean | SD | CV (%) | ||
|---|---|---|---|---|---|---|
| 1 | 2 | |||||
| Serum | ID1 | 0.709 | 0.726 | 0.718 | 0.0120 | 1.7 |
| ID2 | 0.628 | 0.642 | 0.635 | 0.00990 | 1.6 | |
| ID3 | 1.004 | 1.003 | 1.004 | 0.007071 | 0.1 | |
| ID4 | 0.974 | 0.987 | 0.981 | 0.00919 | 0.9 | |
| ID5 | 0.624 | 0.649 | 0.637 | 0.0177 | 2.8 | |
| ID6 | 1.175 | 1.212 | 1.194 | 0.02616 | 2.2 | |
| ID7 | 1.086 | 0.959 | 1.023 | 0.08980 | 8.8 | |
| ID8 | 0.371 | 0.393 | 0.382 | 0.0156 | 4.1 | |
| Plasma (EDTA) | ID1 | 1.092 | 1.107 | 1.100 | 0.01061 | 1.0 |
| ID2 | 0.177 | 0.172 | 0.175 | 0.00354 | 2.0 | |
| ID3 | 0.243 | 0.240 | 0.242 | 0.00212 | 0.9 | |
| ID4 | 0.320 | 0.319 | 0.320 | 0.000707 | 0.2 | |
| ID5 | 0.363 | 0.354 | 0.359 | 0.00636 | 1.8 | |
| ID6 | 0.206 | 0.189 | 0.198 | 0.0120 | 6.1 | |
| ID7 | 0.232 | 0.199 | 0.216 | 0.0233 | 10.8 | |
| ID8 | 0.142 | 0.120 | 0.131 | 0.0156 | 11.9 | |